JasperReports JRViewer
last modified February 12, 2024
In this article we show how display a report created with JasperReports library with JRViewer component.
JasperReports is an open-source reporting library. It can create reports in various formats including PDF, HTML, XLS, or CSV. JRViewer is a component used in Swing-based applications to view the reports generated by JasperReports.
The following application loads data from a bean collection data source and
creates a report from it with JasperReports library. The report is displayed in
a small Swing application with the help of the
JRViewer component.
<?xml version = "1.0" encoding = "UTF-8"?>
<!DOCTYPE jasperReport PUBLIC "//JasperReports//DTD Report Design//EN"
   "http://jasperreports.sourceforge.net/dtds/jasperreport.dtd">

<jasperReport xmlns="http://jasperreports.sourceforge.net/jasperreports"
              xmlns:xsi="http://www.w3.org/2001/XMLSchema-instance"
              xsi:schemaLocation="http://jasperreports.sourceforge.net/jasperreports
                      http://jasperreports.sourceforge.net/xsd/jasperreport.xsd"
              name="report.xml" pageWidth="595" pageHeight="842"
              columnWidth="555" leftMargin="20" rightMargin="20"
              topMargin="20" bottomMargin="20">

    <style name="boldtext" isBold="true"/>
    <style name="background1" mode="Opaque" backcolor="#8DCCE0"/>
    <style name="background2" mode="Opaque" backcolor="#E5ECF9"/>

    <field name="name"/>
    <field name="population" class="java.lang.Long"/>

    <columnHeader>
        <band height="20">

            <staticText>
                <reportElement x="0" y="3" width="300" height="15" style="background1"/>
                <box>
                    <bottomPen lineWidth="1.0" lineColor="#CCCCCC"/>
                </box>
                <textElement/>
                <text><![CDATA[]]></text>
            </staticText>

            <staticText>
                <reportElement x="15" y="5" width="130" height="15" style="boldtext"/>
                <textElement textAlignment="Left"/>
                <text><![CDATA[Country]]></text>
            </staticText>

            <staticText>
                <reportElement x="150" y="5" width="130" height="15" style="boldtext"/>
                <textElement textAlignment="Right"/>
                <text><![CDATA[Population]]></text>
            </staticText>

        </band>
    </columnHeader>

    <detail>
        <band height="15">

            <staticText>
                <reportElement x="0" y="0" width="300" height="14" style="background2"/>
                <box>
                    <bottomPen lineWidth="0.5" lineColor="#CCCCCC"/>
                </box>
                <textElement/>
                <text><![CDATA[]]></text>
            </staticText>

            <textField>
                <reportElement x="15" y="0" width="130" height="15"/>
                <textElement textAlignment="Left" verticalAlignment="Middle"/>
                <textFieldExpression>
                    <![CDATA[$F{name}]]>
                </textFieldExpression>
            </textField>

            <textField>
                <reportElement x="150" y="0" width="130" height="15"/>
                <textElement textAlignment="Right" verticalAlignment="Middle"/>
                <textFieldExpression class="java.lang.Long">
                    <![CDATA[$F{population}]]>
                </textFieldExpression>
            </textField>

        </band>
    </detail>

</jasperReport>
This is the report template file. The template contains two bands: columnHeader and detail.
<style name="boldtext" isBold="true"/>
<style name="background1" mode="Opaque" backcolor="#8DCCE0"/>
<style name="background2" mode="Opaque" backcolor="#E5ECF9"/>
There are three styles used in the template. Styles create modularity and reduce repetition in code.
<field name="name"/>
<field name="population" class="java.lang.Integer"/>
There are two fields in the template. Fields are mapped to the elements of the
data source. In our case, fields are mapped to the attributes of the beans. (We
are using JRBeanCollectionDataSource.)
<staticText>
    <reportElement x="15" y="5" width="130" height="15" style="boldtext"/>
    <textElement textAlignment="Left"/>
    <text><![CDATA[Country]]></text>
</staticText>
<staticText> is used to display labels in the report. This
static text shows a column header.
<textField>
    <reportElement x="15" y="0" width="130" height="15"/>
    <textElement textAlignment="Left" verticalAlignment="Middle"/>
    <textFieldExpression>
        <![CDATA[$F{name}]]>
    </textFieldExpression>
</textField>
A text field is an element which contains an associated expression that is
evaluated with every iteration in the data source to obtain the text content to
be displayed. This text field displays country names. A text field in a detail
band is evaluated for each record in the data source. Since we have seven beans
in our JRBeanCollectionDataSource, the text field is evaluated
seven times.
@Grab(group='net.sf.jasperreports', module='jasperreports', version='6.21.0')
@Grab(group='com.github.librepdf', module='openpdf', version='1.3.39')

import net.sf.jasperreports.engine.JasperCompileManager
import net.sf.jasperreports.engine.JasperFillManager
import net.sf.jasperreports.engine.JasperExportManager
import net.sf.jasperreports.swing.JRViewer
import net.sf.jasperreports.engine.data.JRBeanCollectionDataSource
import javax.swing.JFrame
import java.awt.EventQueue
import java.util.ArrayList
import java.awt.EventQueue
import java.awt.Dimension
import groovy.transform.Immutable

@Immutable
class Country {
    String name;
    Long population;
}

def countries = [
    new Country('China', 1_382_050_000),
    new Country('India', 1_313_210_000),
    new Country('USA', 324_666_000),
    new Country('Indonesia', 260_581_000),
    new Country('Brazil', 207_221_000),
    new Country('Pakistan', 196_626_000),
    new Country('Nigeria', 186_988_000)
]

def ds = new JRBeanCollectionDataSource(countries)

def xmlFile = 'report.xml'
def jreport = JasperCompileManager.compileReport(xmlFile)

def params = [:]
def jrPrint = JasperFillManager.fillReport(jreport, params, ds)

EventQueue.invokeLater(() -> {

    def frame = new JFrame('Jasper report');
    def viewer = new JRViewer(jrPrint)

    frame.add(viewer)
    frame.setSize(new Dimension(750, 650))
    frame.setLocationRelativeTo(null)
    frame.setDefaultCloseOperation(JFrame.EXIT_ON_CLOSE)
    frame.setVisible(true)
})
The example generates a report and displays it in a Jasper viewer.
def ds = new JRBeanCollectionDataSource(countries)
JRBeanCollectionDataSource is a data source implementation that
wraps a collection of Java bean objects. We put seven Country
beans into the data source.
def xmlFile = 'report.xml'
def jreport = JasperCompileManager.compileReport(xmlFile)
We compile the XML template file into a JasperReport.
JasperReport is a compiled template ready to be filled
with data.
def jrPrint = JasperFillManager.fillReport(jreport, params, ds)
With the JasperFillManager.fillReport method, we create a
JasperPrint object; an object that can be viewed, printed, or
exported to other formats.
def viewer = new JRViewer(jrPrint)
We pass the generated JasperPrint to the JRViewer.
frame.add(viewer)
the JRViewer is added to the frame.
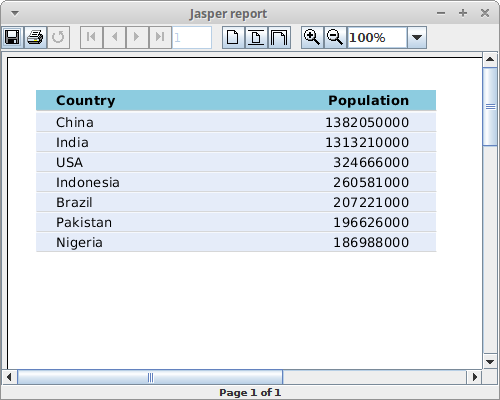
The screenshot shows the Jasper viewer displaying the report.
In this article we have created a report with JasperReports library and
displayed it in a Swing application with JRViewer.